Access and Engagement: Introduction
Access and Engagement: Introduction
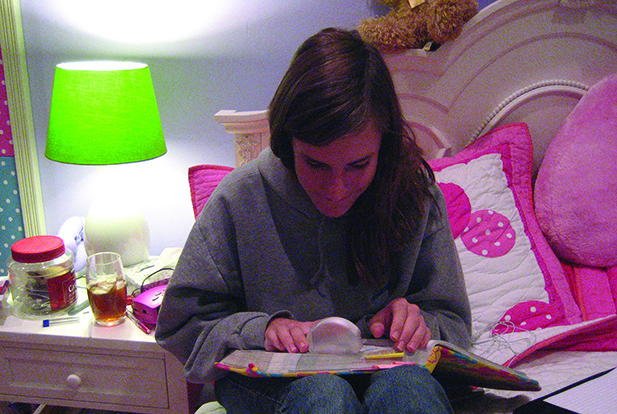
I’m grateful that there are researchers out there with the foresight and compassion to focus on the unique needs of our special needs children during the pandemic. This is obviously hugely disruptive and hard for all children, but I believe the negative impacts for my child will be more far-reaching than [for] typically developing children. [My child] requires more instruction time to progress, and she is less able to adapt to virtual learning. I think there is greater stress on the family system as well simply because having a child with special needs is stressful, even more so if you’re worried [about] developmental/educational regression and their medical vulnerability/fragility if they were to become infected with the virus. —White female family member of a child with low vision with additional disabilities, 7 years old
In late February 2020, the COVID-19 pandemic began to affect Americans and Canadians. The Access and Engagement survey was conducted in the early stages of the United States and Canadian response to the pandemic. The purpose of the survey was to answer the question:
How is the COVID-19 pandemic impacting the education of students with visual impairments, their families, TVIs, and O&M specialists in the United States and Canada?
In late February 2020, the COVID-19 pandemic began to impact American and Canadian adults and in late March 2020 it began to impact children in both countries. The Access and Engagement survey began on April 22 and closed on May 13, 2020. Therefore, the survey results captured what was happening in our educational systems while both countries were in the early response efforts to COVID-19.
According to the American Academy of Pediatrics6, as of September 24, 2020, there were 5,965,268 total confirmed cases of COVID-19 in the United States, of which 624,890 of those cases were children. On September 30, 2020, the Centers for Disease Control reported a total of 194,0917 deaths in the United States of which 113 were children between 0 and 18 years of age8. According to the Government of Canada9, on September 30, 2020, there were a total of 148,547 COVID-19 Canadian cases and 9,297 deaths. Of those cases, 16,555 were children 19 years and under with no reported deaths10.
Although COVID-19 was impacting the lives of those in the United States and Canada during the survey window of April 22 to May 13, 2020, the numbers of COVID-19 cases and deaths both in the United States and Canada were not as high when compared to the number of cases and deaths reported in September 2020 when this report was being finalized. Readers of this report should keep this in mind as they review the information presented. It is probable that if the surveys were conducted again this fall, for example, concerns about the impact of COVID-19 on the education of students with visual impairments, including those with additional disabilities and deafblindness, could be very different. This data reflects those first few weeks of a sudden school closure, for many, and the quick response by educators and their families.
Survey Design and Analysis
The primary collaborators in the development of the survey were Dr. L. Penny Rosenblum, Dr. Tina S. Herzberg, and Dr. Tiffany Wild.
The survey consisted of eight sections:
- Family member of a child, birth to 3 years of age, receiving early intervention
- Family member of a student, 3 to 7 years of age, enrolled in a preschool program
- TVI employed for the 2019-2020 school year
- TVI employed for the 2019-2020 school year
- O&M specialist employed for the 2019-2020 school year
- Demographic information, Canada
- Demographic information, Canada
- Demographic information, Canada
The first six sections were dedicated to the different categories of survey respondents. Sections one through three were for family members of children of different ages.
Participants were asked if they were the family member of a child with a visual impairment in the specified group. If they selected "yes," they were asked a series of questions about their and their child’s experiences.
Sections four through six were for professionals. Participants were asked if they were employed as a TVI, O&M specialist, or dually certified professional for the 2019-2020 school year. If they selected “yes,” they were asked questions specific to their work.
Sections 7 and 8 gathered demographic information about the participants.
Sections 1 to 3 and sections 7 and 8 were made available in Spanish. The survey was also made accessible for users of screen readers (e.g., JAWS, NVDA, VoiceOver).
Only adult family members and professionals completed the survey; no children were invited to participate in the study. Professionals provided their own demographic information; family members provided demographic information for themselves and their child(ren).
Participant Recruitment and Limitations
Survey participants were recruited through the efforts of the sponsoring organizations and companies that emailed, blogged, tweeted, and posted information about the study both in English and in Spanish. The survey was made available to families in English and Spanish and for professionals only in English. Despite recruitment efforts, only five usable surveys were completed by monolingual Spanish-speaking family members of school-age students in the United States.
Due to a problem with the survey logic, not all participants were given the opportunity to answer demographic questions about themselves. Of the 1,264 participants who provided ethnicity information, 1,000 (79.11%) were White. Of the 1,260 participants who provided gender information, 1,099 (87.22%) were female. Readers must keep in mind that the sample is not diverse in ethnicity or gender representation. The lack of diversity in this study sample is not unique to the field of visual impairment, but it does warrant mention. As a field, we must work together to be more inclusive and diverse in recruitment of participants for future research.
Because the survey was only available online and advertised primarily through email and social media, individuals who have no or limited online access or who are not connected with one of the 20 organizations or companies that collaborated to advertise the survey may not have been aware of the survey.
The 1,432 participants in the study sample provided insight into how the COVID-19 pandemic was impacting the education of students with visual impairments, including those with additional disabilities and deafblindness, their families, and the experiences of TVIs, O&M specialists, and dually certified professionals. The data gathered from the participants provided documentation on how the shift was made from education in brick and mortar buildings to education occurring—or in some cases not occurring— during stay-at-home orders in most states and provinces. Both successes and challenges were shared by participants, and their insights were used to shape the recommendations provided in this report.
Demographic Characteristics of Adult Participants
In this section, demographic data for each study participant will be presented. Twenty-three participants provided information about their child and their professional role, two participants provided information about their two children and their professional role, and one participant provided information about their three children and their professional role. Additionally, 12 family members each provided information for two children and one family member provided information for three children.
The map shows where the participants live. The U.S. participants resided in all 50 U.S. states, the District of Columbia, and overseas at a U.S. school on a military base. The Canadian participants resided in six provinces.
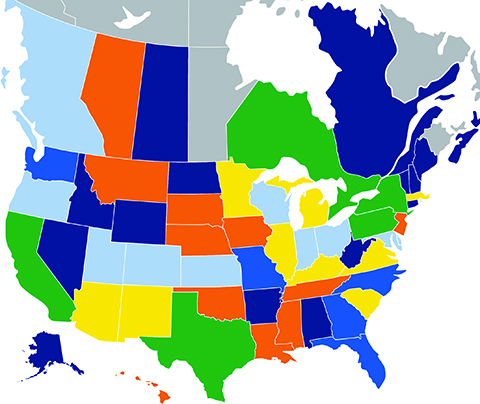
![Key for map above: grey means 0 participants, navy blue means 1-5, orange means 6-10, light blue means 11-20, yellow means 21-30, mid-range blue means 31-40, and green means 40+]](https://www.afb.org/sites/default/files/2020-10/Access%20and%20%20Engagement_pg15_Map_Key.jpg)
Tables 1 and 2 report the demographic information on the participants. There were 1,027 (87.4%) participants from the United States who were female, and just over one-third of those participants reported that they had a disability. In addition, 936 (79.6%) of the U.S. participants were White, and 242 (20.4%) were Black, Indigenous, and People of Color (BIPOC). There were 72 (84.7%) participants from Canada who were female, and almost 40% of those participants reported that they had a disability. In addition, 64 (74.5%) of the Canadian participants were White, and 21 (25.5%) were BIPOC. There were 3 Canadian participants who identified themselves as an Aboriginal person (First Nations, Metis, or Inuit). The United States and Canadian participants were very similar from a demographic perspective.
Table 1: Demographic Data on Participants Residing in the United States
| Characteristic | n | Percentage |
|---|---|---|
| Gender* (n=1,175) | ||
| Male | 100 | 8.5 |
| Female | 1,027 | 87.4 |
| Gender non-conforming/non-binary | 2 | .2 |
| Personally identified or culturally defined identity | 1 | .1 |
| Chose not to provide | 45 | 3.8 |
| Race/Ethnicity* (n=1,178) | ||
| African American/Black | 31 | 2.6 |
| Asian | 14 | 1.2 |
| Hispanic/Latinx | 77 | 6.5 |
| Multiracial | 14 | 1.2 |
| Native Alaskan or American Indian | 10 | .8 |
| Native Hawaiian or Pacific Islander | 4 | .3 |
| White | 936 | 79.6 |
| Other | 13 | 1.1 |
| Chose not to provide | 79 | 6.7 |
| Disability (n=1,091) | ||
| Yes | 385 | 35.3 |
| No | 706 | 64.7 |
Table 2: Demographic Data on Participants Residing in Canada
| Characteristic | n | Percentage |
|---|---|---|
| Gender* (n=85) | ||
| Male | 8 | 9.4 |
| Female | 72 | 84.7 |
| Chose not to provide | 5 | 5.9 |
| Race/Ethnicity* (n=86) | ||
| East Asian | 5 | 5.8 |
| South Asian | 2 | 2.3 |
| West Asian | 1 | 1.2 |
| Black | 3 | 3.5 |
| Indigenous People | 2 | 2.3 |
| White | 64 | 74.5 |
| Other | 2 | 2.3 |
| Chose not to provide | 7 | 8.1 |
| Disability (n=74) | ||
| Yes | 29 | 39.2 |
| No | 45 | 60.8 |
*Gender and ethnicity categories are only included if they had one or more participant(s).
Some family members reported having one or more disabilities. Many shared information about how their own disability affected their children's education.
I’m frustrated, though, that our district and our state [early intervention providers] had zero plan[s] for doing remote instruction for VI kids. It feels like they were guessing at what to do. Plus, no one considered the needs of blind parents at all. Basically, none of the apps and websites that are out there that our district has shared with families work with screen readers. As for accessible learning apps/websites, like ObjectiveEd11, Bookshare12, etc., I’ve had to tell the public school TVI about them, not the other way around. —White female family member of a child with low vision with additional disabilities, 1.5 to 2 years old, and a child with low vision, 6 years old
Demographic Characteristics of Children
In the early intervention, preschool, and school-age sections of the report, we provide information about the children’s descriptive characteristics and ages. Family members were asked to select one of the following four statements that best described their child’s characteristics:
- My child is blind (cannot see more than light and large objects) and has no other learning and/or medical challenges.
- TMy child has low vision (some usable vision) and no other learning and/or medical challenges.
- My child has low vision (some usable vision) and no other learning and/or medical challenges.
- My child is blind (cannot see more than light and large objects) and has other learning and/or medical challenges (e.g., a hearing impairment, motor delays).
- My child has low vision (some usable vision) and/or medical and/or other learning challenges (e.g., a hearing impairment, motor delays).
For ease of reference in this report, the terms blind, low vision, blind with additional disabilities, and low vision with additional disabilities are used.
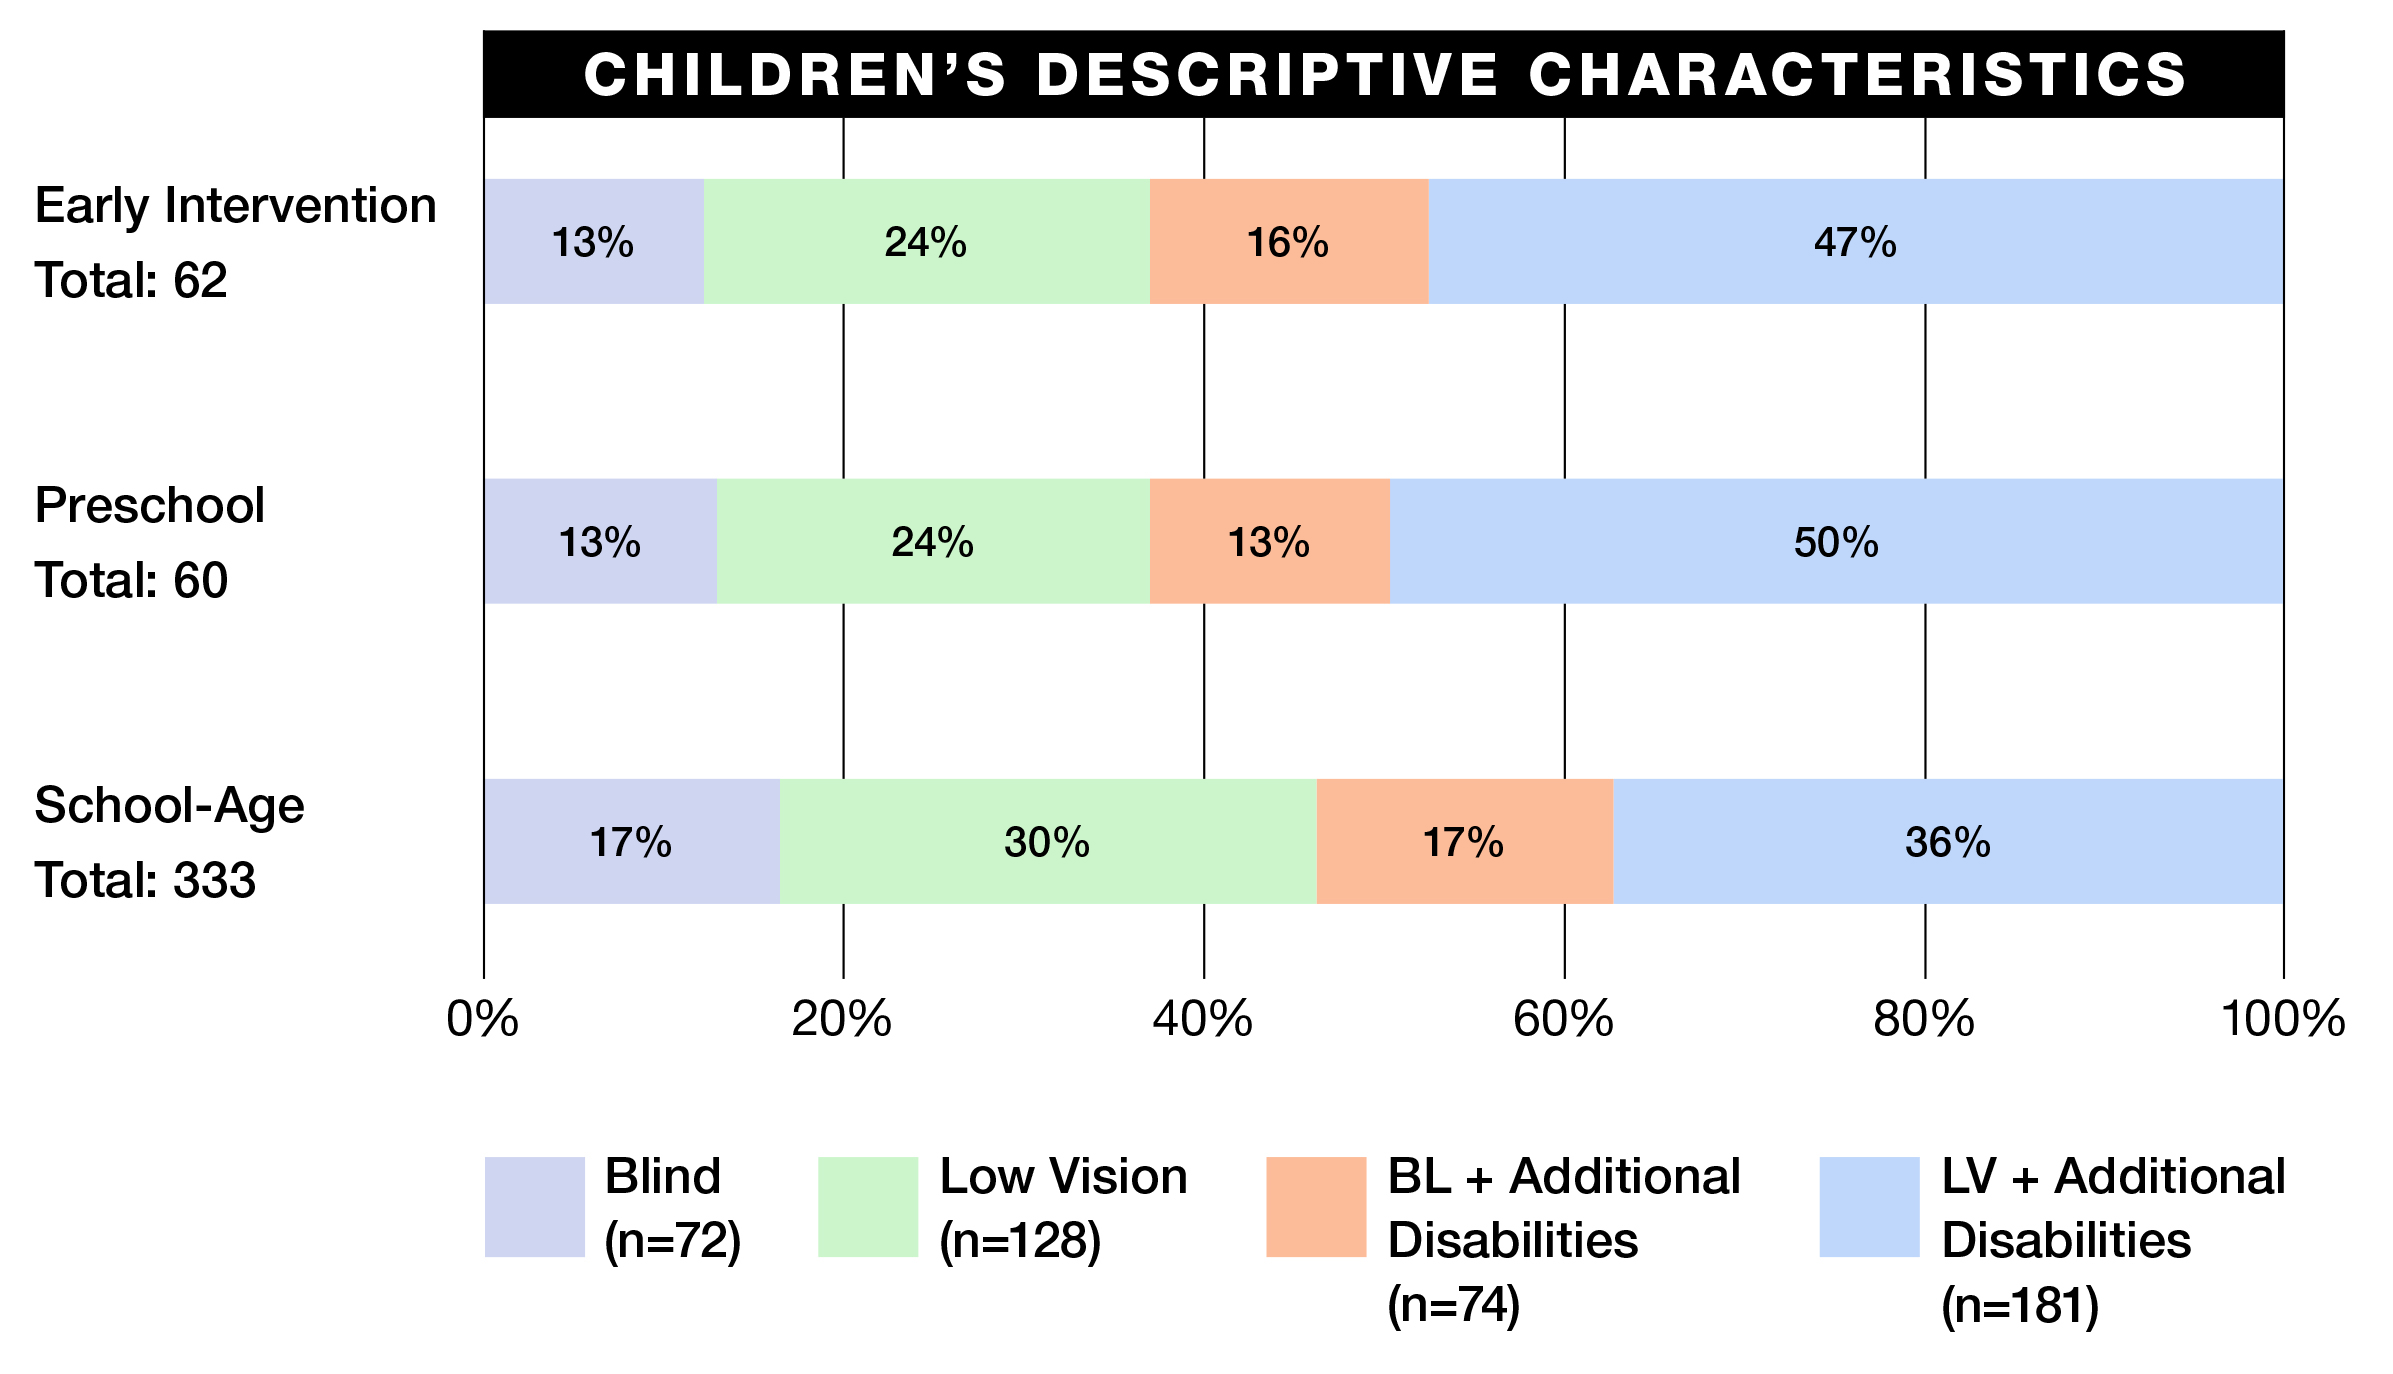
Descriptive Characteristic of Children by Group
The bar graph below shows the number of children by child-descriptive characteristic in each group. The percentages of children with additional disabilities were 62% (n=39 early intervention), 63% (n=38 preschool), and 53% (n=178 school-age) for a mean for all children of 56% (n=255).
Experiences in the Home During the COVID-19 Pandemic
There were 1,249 participants who were given the opportunity to answer questions in this section. Ninety-six percent (n=1,197) of participants reported having Internet access at home on March 1, 2020. It is important for readers to recognize that most of the participants in this study had access to the Internet at home and that data were collected over the Internet. It is probable that if there were participants who did not have access to the Internet at home, their responses may have varied from that of participants in this sample.
Participants were asked to select all the statements that described their household’s experience with COVID-19 and their employment status. In the United States and Canada, participants who were balancing work and childcare/education faced similar challenges, including difficulty finding balance, establishing new routines, and supporting children who were not able to participate in virtual instruction without adult support.
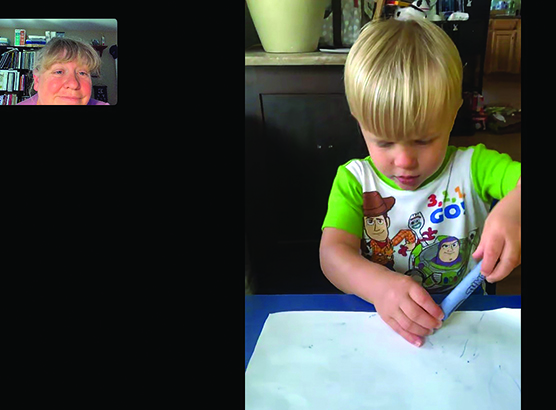
As a healthcare worker, I am exhausted and stressed working. So, coming home to work with my son is a difficult balance.…It has made our playtime more education-focused (fine motor skills) and less lazy family fun—something my son has noticed and dislikes.…Communication with my [educational] team has been essential during this time, even if it can’t be face to face. —White female family member of a child who is blind with additional disabilities, 6 years old
There were 290 family members who provided information about their current employment status. Forty-seven family members were essential workers, 121 were working remotely from home, and 100 were not working. Additionally, 22 family members reported other ways in which they were working, with the most common response being "providing home care for a disabled child" (n=7).
We struggle—demanding jobs where you have to be online with all the extra needs [our child] has in general (e.g., feeding and hygiene) plus the expectations the school has is hard. We are choosing family over the school demands…so that we can keep [our child] engaged and happy and grocery shop and keep jobs and cook and clean and. —White female family member of a child who is blind with additional disabilities, 7 years old
In the United States, 696 professionals were working remotely from home; none were doing so in Canada. Ten professionals in the United States reported that they were no longer employed after March 1, 2020. No Canadian professionals reported that they were no longer employed. Of the 696 professionals working from home, 317 professionals reported that they were also caring for children.
When asked how COVID-19 directly affected those in their household, 1,243 participants responded (U.S. n=1,159, Canada n=84), with 88.17% (U.S. n=1,020, Canada n=76) participants reporting no experiences directly related to COVID-19\. There were participants who chose not to answer the question and some who wrote in their own answers. Participants reported the following:
- Someone in the household had symptoms but had not been tested (U.S. n=52, Canada n=4)
- One or more person in the household had symptoms and had tested negative (U.S. n=21, Canada n=3)
- Someone in the household had tested positive but had not been hospitalized (U.S. n=6, Canada n=1)
- They were assisting in the care of a family member or friend who had contracted COVID-19 (U.S. n=5, Canada n=1)
- One U.S. participant had been hospitalized with COVID-19
- One U.S. participant had someone in the household die from COVID-19
6. https://covid.cdc.gov/covid-data-tracker/#cases_totalcases
7. http://www.canada.ca/en/public-health/services/diseases/2019-novel-coronavirus-infection.htm
8. http://www.cdc.gov/coronavirus/2019-ncov/covid-data/covidview/past-reports/05292020.html
9. http://www.google.com/search?q=canada+covid+19+cases&rlz=1C1GCEA_enUS817US817&oq=
10. https://www150.statcan.gc.ca/t1/tbl1/en/tv.action?pid=1310078501
11. http://www.objectiveed.com/
12. http://www.bookshare.org/cms/